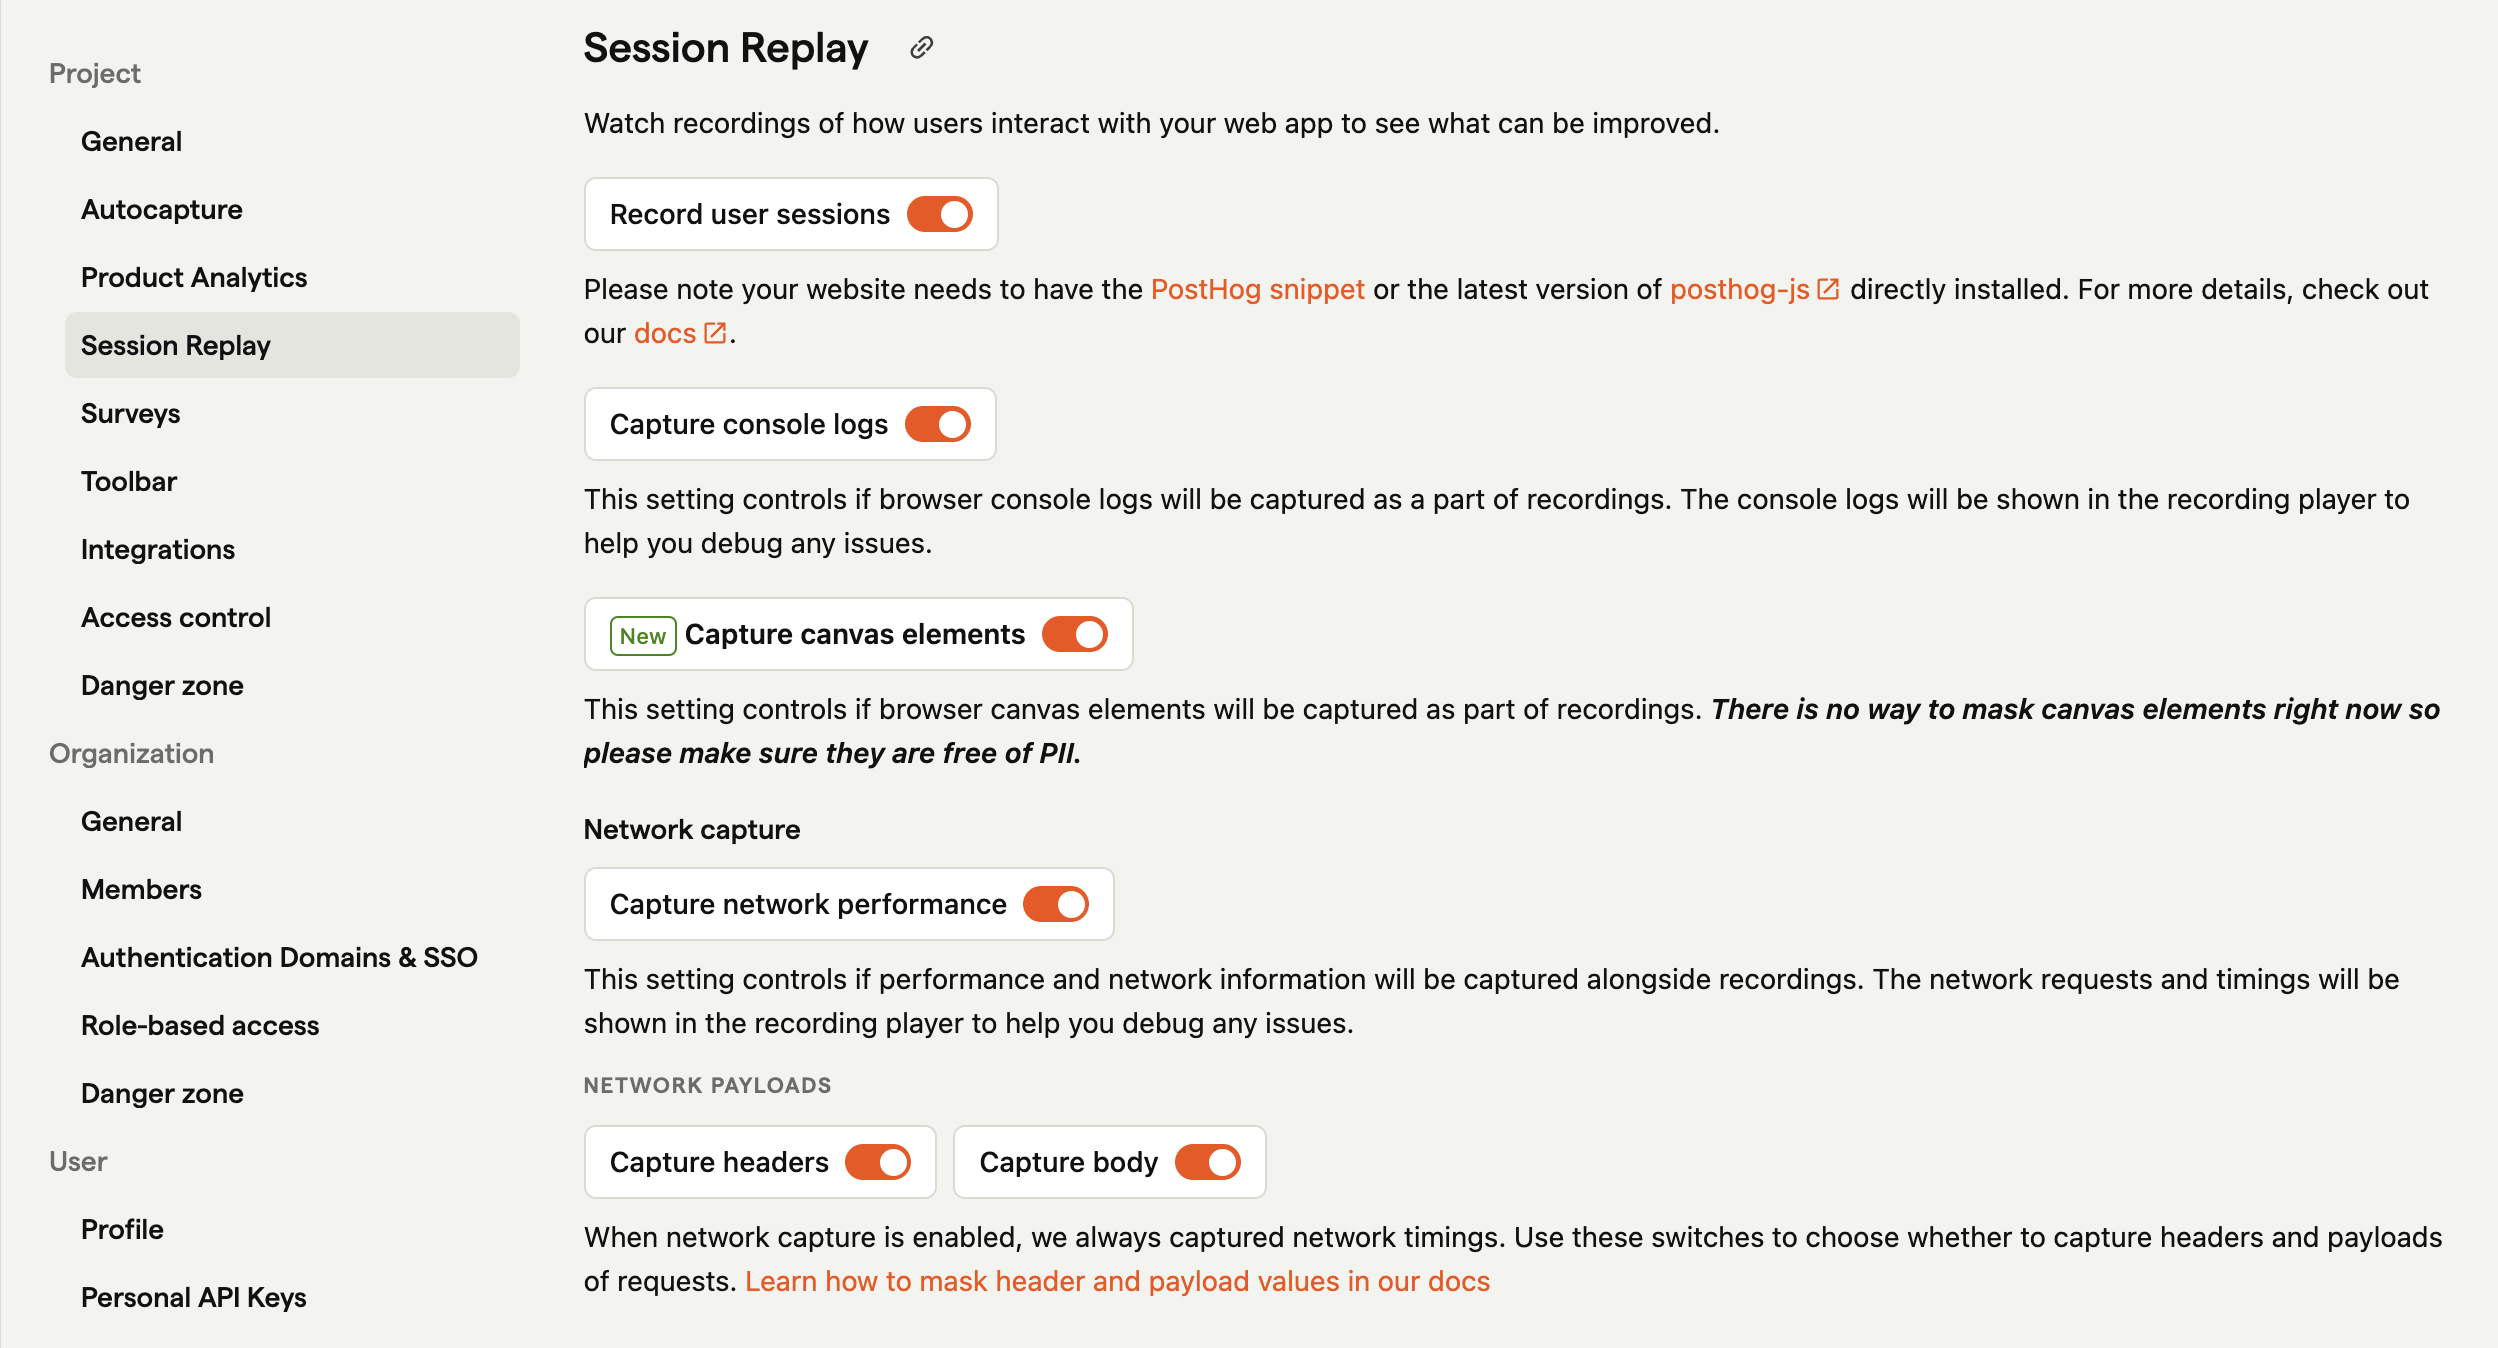
Session replay allows you to capture network requests and responses, providing insights into network performance and potential issues. This feature can be particularly useful for debugging and optimizing your application's network interactions.
PostHog can capture network requests that occur during the browser session, so you can see if your application is sending the expected requests and response, and check the effect of slow network requests or errors on the user experience.
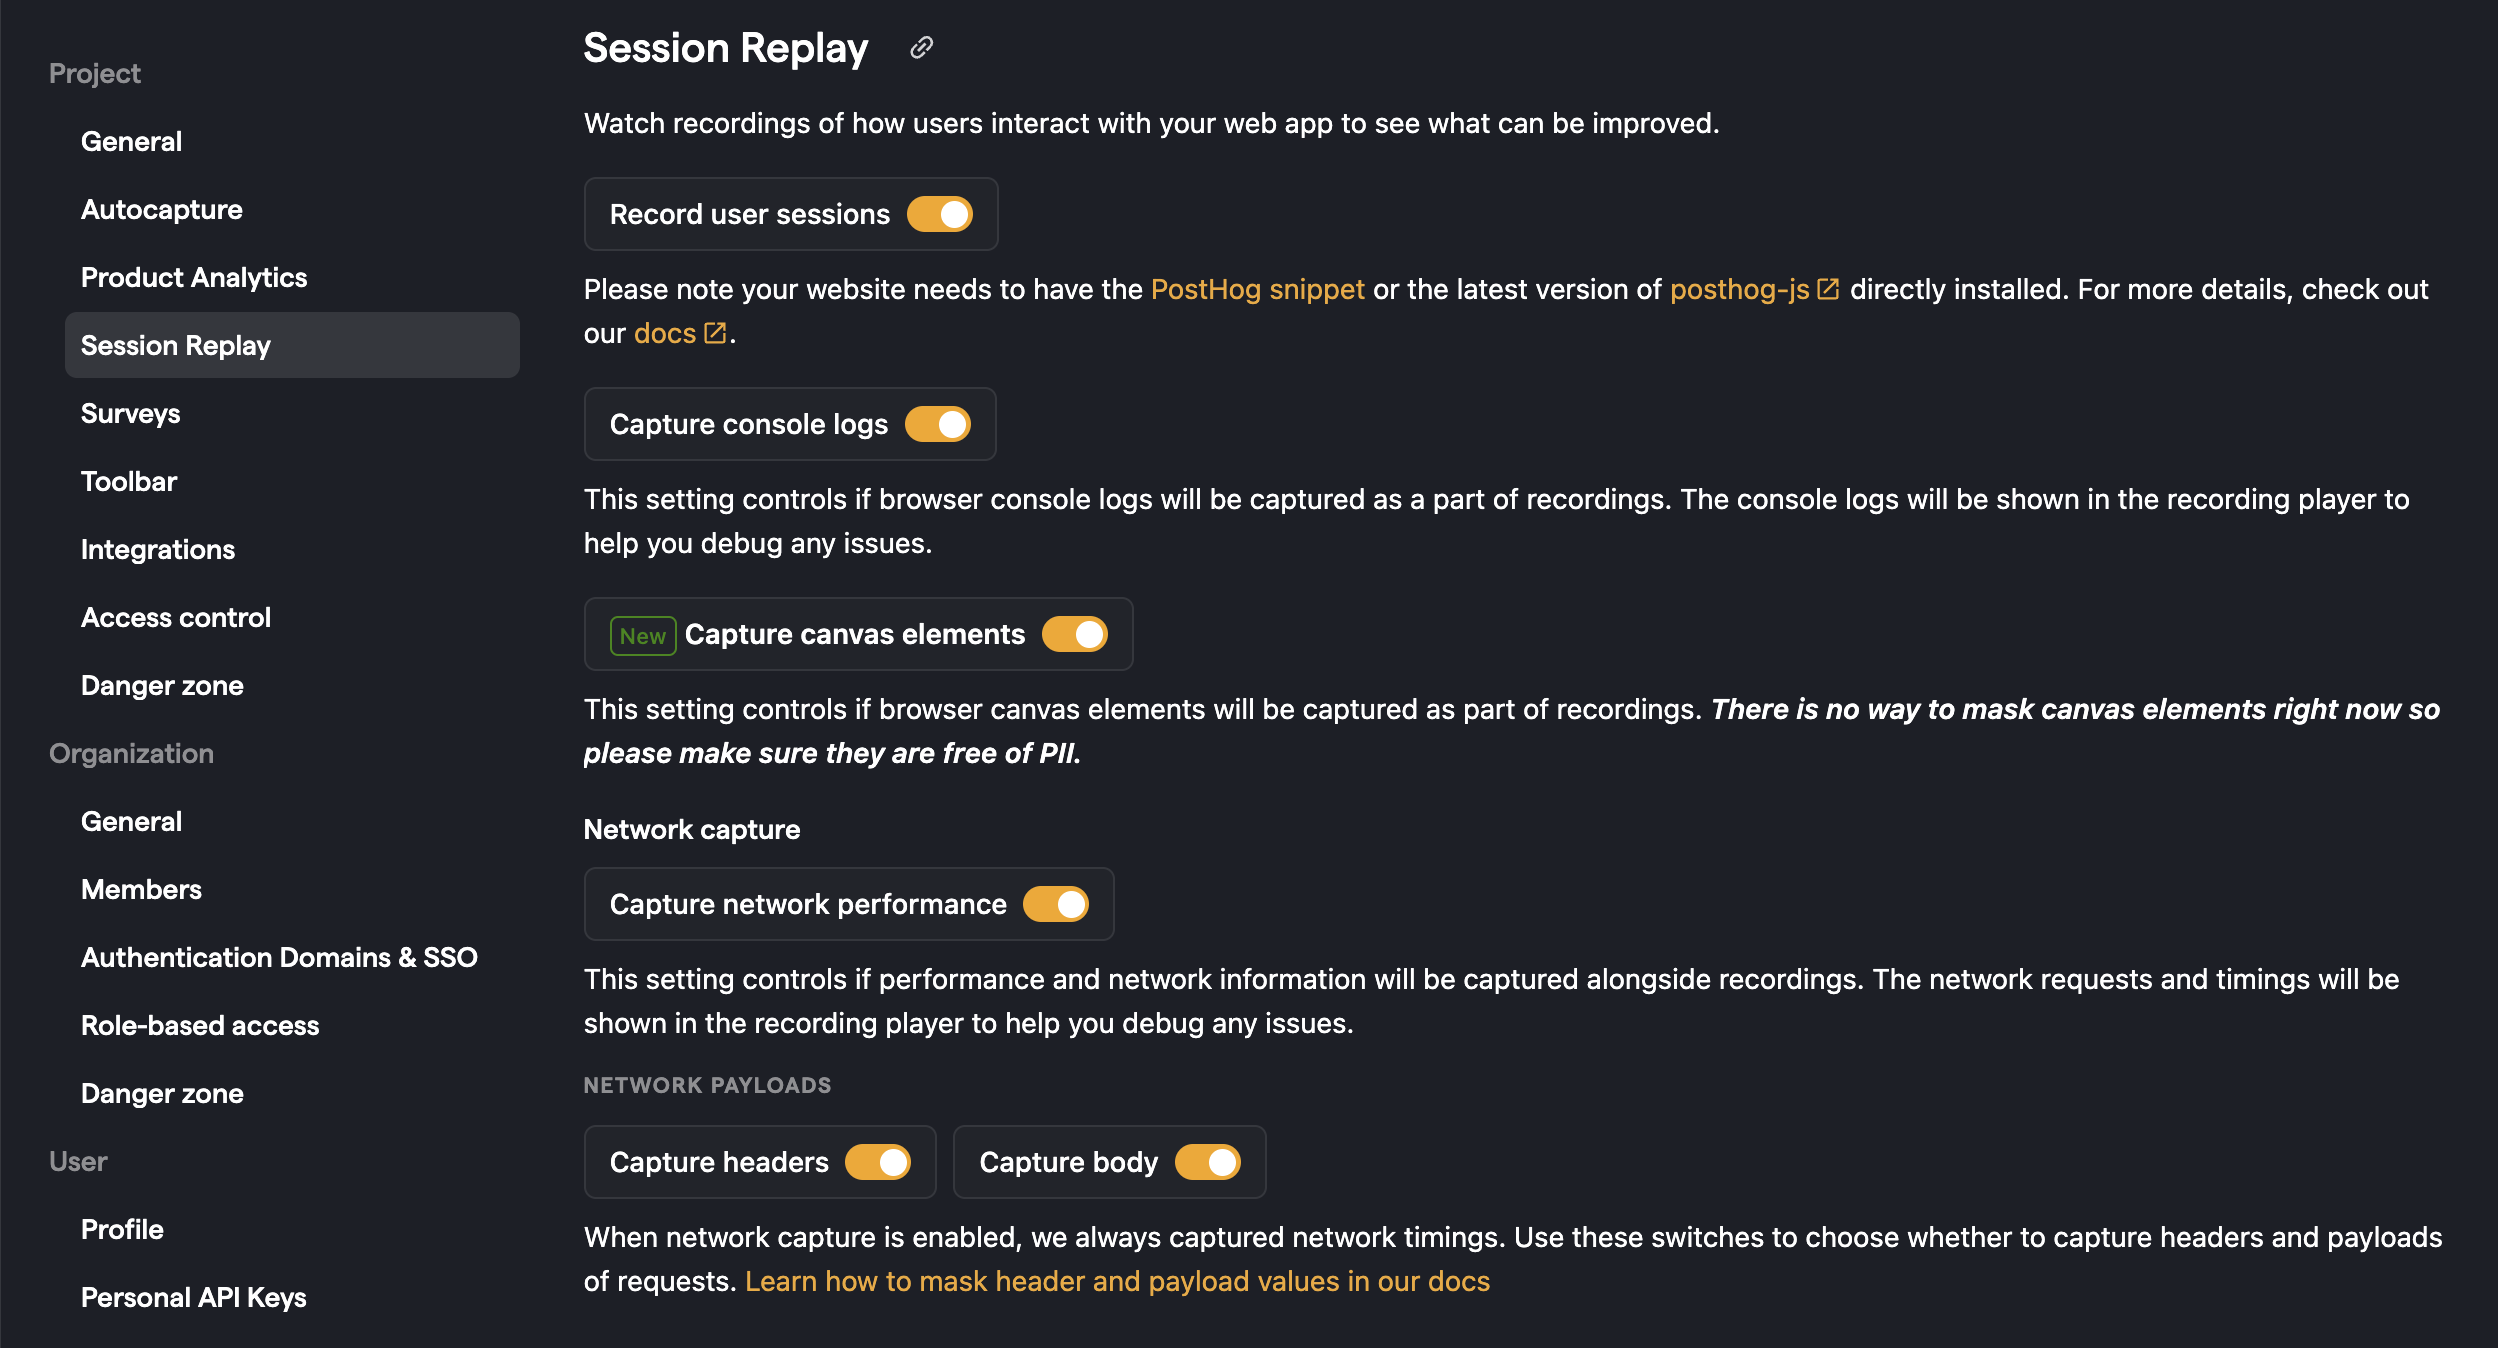
You can enable network recording from your project settings:


When enabled PostHog always captures:
- the network request URL,
- performance information about the request,
When request capture is enabled you can also enabled payload and body capture, this includes:
- the request method
- the response code
- request & response headers (if enabled)
- request & response body (if enabled)
Sensitive information
We automatically scrub some sensitive information from network headers and payloads, but if your request or response payloads could contain sensitive data, you should provide a function to mask the captured data when you initialize PostHog.
We have a deny-list of headers that we will never capture (even if you provide a masking function).
- authorization
- x-forwarded-for
- cookie
- set-cookie
- x-api-key
- x-real-ip
- remote-addr
- forwarded
- proxy-authorization
- x-csrf-token
- x-csrftoken
- x-xsrf-token
And we redact bodies if we believe they contain
- credit card numbers
- social security numbers
- password
- secret
- passwd
- api_key
- apikey
- auth
- credentials
- mysql_pwd
- privatekey
- private_key
- token
Note: If you provide a masking function to alter redaction of payloads it entirely replaces PostHog's automatic payload redaction.
How to register a callback to inspect and redact each network request
Troubleshooting
Recording from localhost
Due to the very high volume of network requests that some tools can make (for example when running hot-reload during development) PostHog does not capture network requests when running on localhost
Requests early in the page lifecycle don't capture all information
PostHog has to wrap fetch and xhr in order to capture network requests. If your application makes network requests before PostHog has had a chance to wrap them, then PostHog will not capture all information about the request.
PostHog truncated the request or response body
In order to maintain service levels we truncate all request and response bodies at 1MB
A network request says it was redacted
We are cautious in what we capture. If you think we're being too cautious you can override the masking function.
I want to query the network performance data I capture
We'd love that too! It's not possible right now but watch this space. You can subscribe for updates in GitHub
Performance considerations
Capturing network performance data can have an impact on your application's performance. Be mindful of the amount of data you're capturing and consider implementing sampling or other optimization techniques if you're dealing with high-volume network traffic.